2022-12-01

Removing Transparent Data Encryption (TDE)

This month blog post is about removing Transparent data encryption (TDE) from a SQL Server database. It's not as simple as you thought. If you do it carelessly, you will be doomed. You will find that the database which was previously encrypted will not mount. You are faced with the error "Cannot find server certificate with thumbprint 'XXXX'.". You then try to restore the database from a backup and get the error "The file "DatabaseFile" failed to initialize correctly. Examine the error logs for more details." This has happened because there are still encrypted values in the log file. If you reach this point and you still have a copy of the certificate used to encrypt the database, restore that certificate to the Master Database and the database that was previously encrypted should mount. If you no longer have the certificate then you can try attaching just the mdf file which should rebuild the log file. If you only have access to a backup file and not the certificate, then you really are stuck.

Let's go to the sample script about how to remove TDE correctly:

/* HOW TO REMOVE TDE
*/
-- CHECK
USE master
GO
SELECT DB_NAME(database_id), * FROM sys.dm_database_encryption_keys;
GO
--DECRYPT
ALTER DATABASE TestDB SET ENCRYPTION OFF
GO
-- CHECK encryption_state 3 --> 1
SELECT DB_NAME(database_id), * FROM sys.dm_database_encryption_keys;
GO
-- WAIT
USE TestDB
GO
DROP DATABASE ENCRYPTION KEY
GO
-- Clear Log
USE master
GO
ALTER DATABASE TestDB SET RECOVERY SIMPLE;
GO
USE [TestDB]
GO
DBCC SHRINKFILE (N'TestDB_log' , 0, TRUNCATEONLY)
GO
-- Reset Log
USE master
GO
ALTER DATABASE TestDB SET RECOVERY FULL;
GO
-- Make Compressed Backup
BACKUP DATABASE TestDB TO  DISK = N'D:\Backup\TestDB.bak' WITH NOFORMAT, NOINIT,  NAME = N'TEstDB-Full Database Backup', SKIP, NOREWIND, NOUNLOAD, COMPRESSION,  STATS = 10
GO

2022-11-04

Error Creating AlwaysOn Availability Group

This month blog post, I would like to share an error case on creating sql server availability group.

I had a pair of sql servers, formed a WSFC, and enabled alwayson availability group feature in SSCM. But later our system administrator said he need to destroy and create again the WSFC. After the WSFC re-created, I tried to create availability group, then I get the following errors:

"Failed to obtain cluster information. Either the specified instance of SQL Server is not running on a Windows Server Failover Cluster (WSFC) node, or the user lacks sysadmin permissions on the SQL Server instance to obtain the cluster information."

"The specified instance of SQL Server is hosted by a system that is not a Windows Server Failover Cluster (WSFC) node."

Here are the troubleshooting steps:

1. Double check availability group feature enabled in all sql replicas.

2. Check your current login got sufficient right to create availability group in all sql replicas, for simplicity, sql server sysadmin server role.

3. Check cluster permission by right-click windows cluster in fail-over cluster manager -> Properties -> Cluster Permissions

By default, the Local Administrator group has Full Control on the WSFC. So for simplicity, the sql sysadmin login you are using should be added to the OS local administrator group too.

4. Run the following sql queries on each sql replica:
SELECT * FROM sys.dm_hadr_cluster_members;
SELECT * FROM sys.dm_hadr_cluster;

It should return some rows like below:

But if no any rows returned, then that sql replica needed to disable and re-enable availability group feature in SSCM.

Solution:
Disabled alwayson availability group feature on the “bad” node using SSCM, then restarted the sql service. Then enable availability group feature again followed by another sql service restart. After finishing this, you will able to get information about the cluster and nodes via the query which I mentioned earlier.

2022-10-02

Repeatable Read causing Deadlock

Last month, one of my client consult me for an incident in its production sql server. They found a stored procedure that being called by multiple concurrent application threads raising deadlock errors frequently, and more seriously the deadlock errors were accumulated. Which means the sql server Lock Monitor (deadlock detection) resolve the deadlocks (by choosing one of the thread, which is the least expensive to roll back, as a deadlock victim, and kill it) not fast enough as the new threads spawned by the client application. (Another ref.: https://learn.microsoft.com/en-us/answers/questions/988682/sql-server-deadlock-detection-only-kills-one-victi.html). This case was very hard to troubleshoot, because the it is a single stored procedure, meaning the threads are accessing tables/objects in exactly the same logical order. Below shows the deadlock graph that being captured:

It seems a very typical deadlock graph, not enough clue provided. But when I opened the deadlock.xdl file in text, I saw isolationlevel="repeatable read (3)":

So I asked my client why the application need to set repeatable read to call that stored procedure. And you guess what they said? They told me that application was developed by outsource software vendor, and it's end-of-support now. In order to convince my client that repeatable read is the problem cause, I showed them a simple demo provided in Microsoft Tech Community:


2022-09-03

Cursor and Lock

Last month one of my client asked me a question, how SQL Server locks a table and its rows while a cursor is looping over it? So let's do an experiment using the StackOverflow2013 sample database.

Run below query on a window in SSMS. (For simplicity I just show you FAST_FORWARD which was mostly recommended by SQL Server MVPs. You can also try any other types of cursor, but I can tell you that the results are the same):

IF @@TRANCOUNT <> 0 ROLLBACK;
DECLARE @Id int;
DECLARE cur CURSOR LOCAL FAST_FORWARD FOR
    SELECT V.Id FROM Votes V JOIN Users U ON V.UserId = U.Id
OPEN cur
WHILE 1 = 1
BEGIN
    FETCH cur INTO @Id
    IF @@FETCH_STATUS <> 0 BREAK
END
CLOSE cur
DEALLOCATE cur

 Get the SPID from the query, here I got spid 57:

While the first query is running, open a new query window, change the spid value, then execute it:

SELECT      r.start_time [Start Time],session_ID [SPID],
            DB_NAME(database_id) [Database],
            SUBSTRING(t.text,(r.statement_start_offset/2)+1,
            CASE WHEN statement_end_offset=-1 OR statement_end_offset=0
            THEN (DATALENGTH(t.Text)-r.statement_start_offset/2)+1
            ELSE (r.statement_end_offset-r.statement_start_offset)/2+1
            END) [Executing SQL],
            Status,command,wait_type,wait_time,wait_resource,
            last_wait_type
FROM        sys.dm_exec_requests r
OUTER APPLY sys.dm_exec_sql_text(sql_handle) t
WHERE       session_id = 57    -- Change it to the SPID number of the first query
ORDER BY    r.start_time
EXEC sp_lock 57;    -- Change it to the SPID number of the first query
-- Change below values to the dbid and ObjId values that you got from above result
SELECT DB_NAME(12), OBJECT_NAME(149575571, 12), OBJECT_NAME(181575685, 12);

Run the second query multiple times during the first one still executing. You can see different locks hold by DECLARE CURSOR, OPEN CURSOR, and FETCH statements:


Here is the summary of the locks being held by each cursor statement:

DECLARE: just defines the attributes of a cursor and the query used to build the result set, but NOT execute the query, so it always run too fast for you to get its lock, and actually it takes no any locks.
FETCH: retrieves one row from the cursor, it only takes DB S lock.
OPEN: opens a cursor and populates it by executing the cursor query. Table/page/row locks will be obtained by this statement. By default (read committed isolation level), once the OPEN statement finished, locks will be released. So NO table/page/row locks inside each loop for the cursor query.

Final thought: cursors could be used in some applications for serialized operations, but generally they should be avoided because they bring a negative impact on performance, especially when operating on a large sets of data.

2022-08-04

Implicit Conversion performance hurt and how to solve it

SQL Server will perform Implicit Data Type Conversion to convert values from the original data type to another data type, in order to be able to make a comparison on two expressions of different types, when the query didn't explicitly specified the conversion on either side. SQL Server decides which side to apply the implicit conversion based on the Data Type Precedence which lower type will be converted to upper type. These hidden conversions can hurt performance, especially if it has to apply row-by-row. Mostly it will make the query engine to ignore any useful index and so will do table scanning.

Let's do an experiment to show how the problem happens and the solution of it. Here I use the StackOverflow2013 sample database's User table, but I altered the DisplayName column in it to type varchar, as varchar is a lower precedence data type. Then I created an index on this column. Let's see a query that will perform implicit conversion:
DECLARE @p Nvarchar(40);
SET @p = 'Community';
SELECT * FROM Users WHERE DisplayName = @p;

The input parameter @p is Nvarchar type, which is higher precedence than the column type varchar, so the CONVERT_IMPLICIT function was applied on the table column. In this case, the query is not SARGABLE and so it cannot do index seek, the query performs bad. A yellow band on the left-most root SELECT operator also indicates there's an implicit type conversion warning.


Let's try to solve it by giving the same type to the parameter:
DECLARE @p varchar(40);
SET @p = 'Community';
SELECT * FROM Users WHERE DisplayName = @p;

Now the query becomes sargable and can do index seek.
Another solution is to do an explicit conversion on the scalar value:
DECLARE @p Nvarchar(40);
SET @p = 'Community';
SELECT * FROM Users WHERE DisplayName = CAST(@p AS varchar(40));

It can get the same good result.

Implicit conversions hurt performance, especially when the implicit conversion causes SQL Server to perform it row-by-row on a table. If we found an implicit conversion in our query, the best solution is to put an explicit conversion somewhere else. For instance, if we have a scalar value, rather than allowing SQL Server to convert the column to match the type of the scalar, we can put an explicit conversion to change the scalar to match the type of the column. This allows SQL Server to choose index seek, and carry out the query with fewer overall resources.

2022-07-06

Will a Cancelled Query also count in Performance Statistics?

SQL Server has two very useful dynamic management views, sys.dm_exec_query_stats and sys.dm_exec_procedure_stats DMVs, which let us DBA to find out which queries and stored procs are expensive in terms of processing time, I/O, duration, etc. Every time a query or a stored procedure is executed, that execution's performance figures will be added into the performance statistics. But what if the execution was cancelled by the client application, such as due to being blocked and then the client timeout? Will the cancelled execution still be counted in the performance statistics? This month blog post I will do an experiment to check it out.

1. Let's create a simple testing table and stored proc:
USE TestingDB;
GO
DROP TABLE IF EXISTS dbo.Table1;
CREATE TABLE Table1 (
    pk int IDENTITY(1,1) NOT NULL PRIMARY KEY,
    col [varchar](50) NULL
);
GO
CREATE OR ALTER PROC TestSP
    @p varchar(50)
AS
BEGIN
SET NOCOUNT ON;
BEGIN TRAN
SELECT 'Before', * FROM Table1;
INSERT Table1 (col) VALUES (@p);
SELECT 'After', * FROM Table1;
COMMIT
END
GO

2. Execute the stored proc 3 times in order to populate the performance statistics:
EXEC TestSP 'X';
EXEC TestSP 'X';
EXEC TestSP 'X';


3. Check the performance statistics of the queries inside the stored proc, and the whole stored proc:
SELECT DB_NAME(qt.[dbid]) as DB, OBJECT_NAME(qt.objectid, qt.[dbid]) AS Obj,
    SUBSTRING(qt.[text], qs.statement_start_offset/2+1,
    (CASE WHEN qs.statement_end_offset = -1
        THEN LEN(CONVERT(nvarchar(max), qt.[text]))*2 ELSE qs.statement_end_offset END - qs.statement_start_offset)/2
    ) AS query_text, qs.statement_end_offset,
    qs.execution_count, qs.creation_time, qs.last_execution_time, qs.last_elapsed_time, qs.max_elapsed_time
FROM sys.dm_exec_query_stats AS qs CROSS APPLY sys.dm_exec_sql_text(qs.[sql_handle]) AS qt
WHERE qt.[dbid]=DB_ID('TestingDB') AND qt.objectid=OBJECT_ID('TestingDB.dbo.TestSP')
ORDER BY qs.statement_start_offset;

SELECT DB_NAME(database_id) AS DB, OBJECT_NAME([object_id], database_id) AS Obj,
    execution_count, cached_time, last_execution_time, last_elapsed_time, max_elapsed_time
FROM sys.dm_exec_procedure_stats
WHERE database_id=DB_ID('TestingDB') AND [object_id]=OBJECT_ID('TestingDB.dbo.TestSP');

As you can see, both the queries and the stored proc are executed 3 times.

4. Open another query window, execute below query to lock the whole table:
SET TRANSACTION ISOLATION LEVEL SERIALIZABLE;
BEGIN TRAN
SELECT * FROM Table1;

5. In the previous window, execute the TestSP stored proc again, now it's being blocked. You can check it on the Activity - All Blocking Transaction server report:

You can see that the query being blocked is the INSERT Table1 statement inside the stored proc.

6. Now press the red square button to CANCEL the TestSP execution. Then check the performance statistics again:

It shows the first SELECT statement in the stored proc is executed (execution_count = 4), the last SELECT is skipped (exec_count = 3), which can be imagined. The most interesting point is, SQL Server was really tried hard to execute the INSERT statement, unfortunately being blocked, and then the whole stored proc was cancelled by the client application (yes, you, haha), and sadly its query_stats does NOT count in this hardworking try (exec_count = 3). But the procedure_stats surprisingly counts in that cancelled execution.

Conclusion:
Cancelled QUERY execution will NOT count in sys.dm_exec_query_stats.
But cancelled STORED PROC will count in sys.dm_exec_procedure_stats.

The moral:
* That's why DBA likes stored procs rather than ORM/query generated from application code!
* To monitor blocking, we should enable blocked process report session.

2022-06-10

[Microsoft][ODBC SQL Server Driver][DBNETLIB]SSL Security error

One of my clients encountered the following error, when they tried to make a connection from an application to the SQL server. [Microsoft][ODBC SQL Server Driver][DBNETLIB]SSL Security error.

From my experience, most likely this is a TLS issue where the TLS version being used in the application server doesn't match the TLS version required by the database server. Below steps demonstrate how to fix it.

1. In the database server, check the TLS versions being enabled, by checking in below registry keys:
HKEY_LOCAL_MACHINE\SYSTEM\CurrentControlSet\Control\SecurityProviders\SCHANNEL\Protocols\TLS 1.x\<Client and Server>\DisabledByDefault
HKEY_LOCAL_MACHINE\SYSTEM\CurrentControlSet\Control\SecurityProviders\SCHANNEL\Protocols\TLS 1.x\<Client and Server>\Enabled
If you see that both TLS 1.0 and 1.1 are DisabledByDefault=1 and Enabled=0 likes below screenshot, then your database server was set to accept TLS 1.2 only.


2. Check the SQL Server version, by running SELECT @@VERSION query. If you use TLS 1.2, not every SQL Server release supports TLS 1.2, please refer to KB3135244 - TLS 1.2 support for Microsoft SQL Server to determine whether you need to upgrade or update your SQL Server.

3. In the application server, download and install the most recent ODBC driver for SQL Server (Microsoft ODBC Driver 17 for SQL Server already support TLS 1.2). Then change the connection string in the application config to use the new driver.

2022-05-03

Why I prefer INNER JOIN rather than Comma Separated Join

This month blog post I would like to discuss a topic about SQL coding style. Old-school SQL programmers mostly write table join query using comma separated style, e.g.
SELECT ... FROM TableA, TableB WHERE TableA.x=TableB.y
Yes, there are no any differences in terms of query result, execution plan, and performance. But INNER JOIN is considered better for readability, while comma-separated join can easily leads to human coding mistake.

Let's take a look at below example on StackOverflow2010 database:
-- INNER JOIN
SELECT COUNT(*) FROM Users U JOIN Posts P ON U.Id=P.OwnerUserId
WHERE U.DisplayName='Brent Ozar';
-- Versus Comma-Separated Join
SELECT COUNT(*) FROM Users U, Posts P
WHERE U.Id=P.OwnerUserId AND U.DisplayName='Brent Ozar';

Both of them are written correctly. So let's check their results, STATISTICS IO, and execution plans:


As you can see, they have no any differences. So some old-school folks prefers comma-separated, as they thought shorter coding means easier to read and write.

But how about if the programmer forgot to put in the table join predicates? Especially when a query involves multiple tables to join and complex filtering, it's comma-separated join is more error-prone than INNER JOIN. E.g.
-- INNER JOIN forgot to put in the ON clause
SELECT COUNT(*) FROM Users U JOIN Posts P
WHERE U.DisplayName='Brent Ozar';
-- Versus Comma-Separated Join forgot the table join predicate
SELECT COUNT(*) FROM Users U, Posts P
WHERE U.DisplayName='Brent Ozar';

In this case, INNER JOIN can prevent such coding mistake by throwing complication error. But comma-separated join will produce Cartesian product which gives you wrong result, table scan operators impose huge loading on your database server, and whole table being locked.

Take away:
Always use INNER JOIN (or JOIN if you like shorter coding) rather than comma-separated join!

2022-04-08

Missing Index Suggestion VS Database Engine Tuning Advisor

This month blog post I would like to share a performance tuning case. Actually I used to rely on missing index DMVs (I had a post too) and get away from Database Engine Tuning Advisor (DTA) as DTA mostly give you too many indexes to add which will slow your database DML workload. But recently I found there are a few cases that missing index suggestion cannot give you the right index to add while DTA can, and these cases are so obvious that even a developer just take a glance can make the index suggestion. Let's take a look at the below experiment on StackOverflow2013 sample database:

USE StackOverflow2013
GO
SELECT MIN(CreationDate) FROM Users;
SELECT MAX(CreationDate) FROM Users;
SELECT TOP 1 CreationDate FROM Users ORDER BY CreationDate;

You can easily infer that an index on column CreationDate can speed up these queries, but look at the actual execution plan, no any missing indexes being suggested, seems SQL Server just happily to run them by Cluster Index Scan:

You may say that because SQL Server thinks the table is too small, so don't bother to consider index seek. But in fact the table has 2 millions rows, and the STATISTICS IO also shows that the scanning operators are not cheap:
Table 'Users'. Scan count 1, logical reads 44530, physical reads 0, page server reads 0, read-ahead reads 0, page server read-ahead reads 0, lob logical reads 0, lob physical reads 0, lob page server reads 0, lob read-ahead reads 0, lob page server read-ahead reads 0.
Table 'Users'. Scan count 1,
logical reads 44530, physical reads 0, page server reads 0, read-ahead reads 0, page server read-ahead reads 0, lob logical reads 0, lob physical reads 0, lob page server reads 0, lob read-ahead reads 0, lob page server read-ahead reads 0.
Table 'Users'. Scan count 5,
logical reads 45184, physical reads 0, page server reads 0, read-ahead reads 0, page server read-ahead reads 0, lob logical reads 0, lob physical reads 0, lob page server reads 0, lob read-ahead reads 0, lob page server read-ahead reads 0.
Table 'Users'. Scan count 5,
logical reads 45184, physical reads 0, page server reads 0, read-ahead reads 0, page server read-ahead reads 0, lob logical reads 0, lob physical reads 0, lob page server reads 0, lob read-ahead reads 0, lob page server read-ahead reads 0.

Now let's try the same queries on DTA.

DTA can give you the good suggestion:

CREATE NONCLUSTERED INDEX [_dta_index_Users_12_149575571__K4] ON [dbo].[Users]
(
    [CreationDate] ASC
)WITH (SORT_IN_TEMPDB = OFF, DROP_EXISTING = OFF, ONLINE = OFF) ON [PRIMARY]

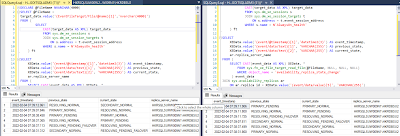
Now let's add the new index suggested by DTA, then re-run the workload queries in SSMS to check the actual execution plan and statistics io:

Table 'Users'. Scan count 1, logical reads 3, physical reads 0, page server reads 0, read-ahead reads 0, page server read-ahead reads 0, lob logical reads 0, lob physical reads 0, lob page server reads 0, lob read-ahead reads 0, lob page server read-ahead reads 0.

As you can see, the new index suggested by DTA [_dta_index_XXX] is being used, and the logical read is hugely reduced.

The conclusion is, rather than solely rely on missing index suggestions, DTA should also be considered. We should compare both results and merge the suggestions.


2022-03-02

How OPTIMIZE FOR UNKNOWN estimates the number of rows return

OPTIMIZE FOR is a query hint that can help with the parameter sniffing problem, but it requires you to specify a literal constant value for a local variable used in the query. On the other hand, OPTIMIZE FOR UNKNOWN, which was introduced in SQL Server 2008, doesn't require you to specify a constant value, the query optimizer will use statistical data instead to determine the value for a local variable during query optimization. In this blog post, I will explain how the query optimizer engine calculates the estimated number of rows by using the information on the density vector of the column statistics.

To better understand how OPTIMIZE FOR UNKNOWN works, let's create the following test stored procedure in AdventureWorks2017 database:

USE AdventureWorks2017
GO
CREATE OR ALTER PROC test
    @pid int
AS
SET NOCOUNT ON;
SELECT * FROM Sales.SalesOrderDetail
    WHERE ProductID = @pid
    OPTION (OPTIMIZE FOR UNKNOWN) ;
GO

Running this stored procedure, the actual execution plan shows the estimated number of rows 456.079


As the [Sales].[SalesOrderDetail] table has an index [IX_SalesOrderDetail_ProductID] on its [ProductID] column, let's check the density value from the statistics of this index.

Density is information about the number of duplicates in a given column or combination of columns and it is calculated as 1/(number of distinct values). We can verify the density value 0.003759399 from below query.


From the statistics, the total number of rows in the table is 121317

To obtain the estimated number of rows, the query optimizer engine multiplies the column density value by the total number of rows in the table, 0.003759399 * 121317 = 456.079, as shown on the actual execution plan which the first picture illustrated.

2022-02-04

Availability Group Failover History

This blog post illustrates how to check history of failovers of alwayson availability group. Below query can be used to check it by querying the alwayson_health extended events session (created and started automatically when you create the availability group using SSMS New Availability Group Wizard).

DECLARE @FileName NVARCHAR(4000)
SELECT @FileName =
target_data.value('(EventFileTarget/File/@name)[1]','nvarchar(4000)')
FROM (
        SELECT
            CAST(target_data AS XML) target_data
            FROM sys.dm_xe_sessions s
            JOIN sys.dm_xe_session_targets t
                ON s.address = t.event_session_address
            WHERE s.name = N'AlwaysOn_health'
    ) ft
 
SELECT
    XEData.value('(event/@timestamp)[1]','datetime2(3)') AS event_timestamp,
    XEData.value('(event/data/text)[1]', 'VARCHAR(255)') AS previous_state,
    XEData.value('(event/data/text)[2]', 'VARCHAR(255)') AS current_state,
    ar.replica_server_name
FROM (
    SELECT CAST(event_data AS XML) XEData, *
        FROM sys.fn_xe_file_target_read_file(@FileName, NULL, NULL, NULL)
        WHERE object_name = 'availability_replica_state_change'
     ) event_data
JOIN sys.availability_replicas ar
    ON ar.replica_id = XEData.value('(event/data/value)[5]', 'VARCHAR(255)')
ORDER BY event_timestamp DESC;
 
Make sure the AlwaysOn_health session is running first.

We could run the same query on any of the availability replicas to see their state change histories.


2022-01-07

Server Low Memory causes SQL Server hang and Availability Group failover

This month blog post I would like to share a case that I encountered and was solved by calling Microsoft premier support. I have a SQL Server 2016 primary instance that configured high availability with other 3 nodes on an availability group, hosting a mission critical database total 6TB, the primary sql instance only had 64GB hardware memory. Client programs sometimes run a batch job which involves high volume of data import and read on that mission critical database. Database inaccessible occurs occasionally while the batch program running, made the batch failed and needed to restart again. Users complained on this problem. Checking the sql server error log, error messages were found as below:

Process 0:0:0 (0x5748) Worker 0x000001DD933D0160 appears to be non-yielding on Scheduler 7. Thread creation time: 13283945227971. Approx Thread CPU Used: kernel 130515 ms, user 0 ms. Process Utilization 62%. System Idle 33%. Interval: 130527 ms.

***Stack Dump being sent to D:\Program Files\Microsoft SQL Server\MSSQL13.HKRDBSP1\MSSQL\LOG\SQLDump0017.txt

Always On Availability Groups connection with secondary database terminated for primary database 'XXX' on the availability replica 'XXX' with Replica ID: {b94d35e1-6b50-48f3-8421-93fe6bf7c8b0}. This is an informational message only. No user action is required.

Unable to access availability database 'XXX' because the database replica is not in the PRIMARY or SECONDARY role. Connections to an availability database is permitted only when the database replica is in the PRIMARY or SECONDARY role. Try the operation again later.

As an application DBA, when we see dump was generated by SQL Server, what we can do is only call Microsoft for help. Below is the investigation done by Microsoft support engineer:

Below are non-yielding call stacks of the dump. We found SQL SERVER was hung when allocating memory. Kernel time is the majority which means the slowness is in windows OS.

# Call Site

00 sqldk!SOS_MemoryBlockAllocator::CommitBlockAndCheckNumaLocality

01 sqldk!SOS_MemoryBlockAllocator::AllocateBlock

02 sqldk!SOS_MemoryWorkSpace::AllocatePage

03 sqldk!MemoryNode::AllocatePagesInternal

04 sqldk!MemoryNode::AllocatePages

05 sqldk!MemoryClerkInternal::AllocatePagesWithFailureMode

06 sqldk!MemoryClerkInternal::AllocatePages

07 sqldk!TVarPageMgr<0>::PviNewVarPage

08 sqldk!TVarPageMgr<0>::PbAllocate

09 sqldk!CMemObj::InlineAlloc

0a sqldk!CMemObj::Alloc


IncidentType                          NonYieldingScheduler

OffenderThreadId                 ~256

IsPreemptive                          False

Wall_clock_time_ms             70215

Kernel_time_ms                     70203

User_time_ms                        0

passes                                     15

Suggestion

1. Please enable ‘Lock pages in memory’ for this SQL SERVER. ‘Lock pages in memory’ will use AWE api to allocate memory. It will be more efficient.

Please follow below official article. Add “Lock pages in memory” privilege to “SQL Service account”.

https://technet.microsoft.com/en-us/library/ms190730(v=sql.105).aspx

2. Please increase physical memory for this VM to 128GB, and increase the sql server max server memory setting to 112GB.