2021-12-13

Missing Index Recommendation Column Order

When SQL Server is processing a query, it will sometimes make a suggestion for an index that it believes will help that query run faster. These are known as missing indexes, which can be obtained from the missing index DMVs, or more directly by showing the graphical execution plan when you execute the query in SSMS. But can you blindly create the missing index that recommended by SQL Server? In this post, I will show you why you cannot blind trust what SQL Server told you to do.

CREATE TABLE Candidates (

id int PRIMARY KEY IDENTITY(1, 1),

gender char(1) NOT NULL,

displayName varchar(10) NOT NULL

);

GO

SET NOCOUNT ON;

INSERT Candidates (gender, displayName) SELECT 'M', substring(replace(newID(), '-', ''), cast(RAND() * (31 - 10) AS INT), 10);

GO 500000

INSERT Candidates (gender, displayName) SELECT 'F', substring(replace(newID(), '-', ''), cast(RAND() * (31 - 10) AS INT), 10);

GO 500000

UPDATE STATISTICS Candidates WITH FULLSCAN;

GO

-- Enable Actual Execution Plan for below query

SELECT displayName, gender FROM Candidates WHERE displayName = 'CF53A906FD' AND gender = 'M' OPTION (RECOMPILE);

And here is the recommended index to create:

CREATE NONCLUSTERED INDEX [<Name of Missing Index, sysname,>] ON [dbo].[Candidates] ([gender],[displayName]);

As you can see, the column order has no any considerations on selectivity, they are just a comma-delimited list of column order in the table (actually the key columns in the recommended index will be ordered by equality predicate group first, then inequality predicate group, and inside each group follows the column order in table definition). You can double check the column order in the table definition by executing sp_help system stored procedure.

2021-11-04

Solving Last-Page Insert Latch Contention by SQL Server 2019 new feature: OPTIMIZE_FOR_SEQUENTIAL_KEY

Two years ago I wrote a blog post Solving Last-Page Insert Latch Contention by Index Partitioning which explains how to solve a problem called last-page insert PAGELATCH_EX contention, That is if you have an even-increasing index on a table, such as IDENTITY or GETDATE(), then during huge amount of concurrent queries/threads inserting new rows into that table, different threads will contend for exclusive latch PAGELATCH_EX on the last data page of that index in the buffer pool. The solution that I provided on that old post requires adding a computed column on the table, append that column into the clustered index, and enabling table partitioning, which involved quite a lot of table structure changes. SQL Server 2019 introduces a new feature, OPTIMIZE_FOR_SEQUENTIAL_KEY, which is a new index option that intended to address the last page insert contention. Below demonstration shows how you do that.
--When you create the table, e.g.
CREATE TABLE DemoTbl (
Id INT IDENTITY(1, 1) NOT NULL,
col1 varchar(50),
CONSTRAINT PK_DemoTbl PRIMARY KEY CLUSTERED (Id ASC) WITH (OPTIMIZE_FOR_SEQUENTIAL_KEY = ON)
);
GO
--When you create the index, e.g.
CREATE INDEX DemoTbl_Id ON DemoTbl (Id) WITH (OPTIMIZE_FOR_SEQUENTIAL_KEY = ON);
GO
--Or if you need to alter an existing index:
ALTER INDEX DemoTbl_Id ON DemoTbl SET(OPTIMIZE_FOR_SEQUENTIAL_KEY = ON);
GO
--Check which indexes enabled this option in the current database:
SELECT * FROM sys.indexes WHERE optimize_for_sequential_key = 1;
GO
Simple enough :)

2021-10-11

Availability Group Listener RegisterAllProvidersIP Setting

Last month I encountered an issue on our production sql server availability group, the AG listener fails to connect after failover. After spending hours to troubleshoot the problem with Microsoft support engineer, we find out the root cause is the cluster resources didn't register all listener IP addresses. There is only one IP address of the primary server, where our sql server is actually configured across multiple subnets. In order to solve it, we executed PowerShell command Set-ClusterParameter RegisterAllProvidersIP 1 which enables the RegisterAllProvidersIP setting on the AG listener. The lesson learned: When we set up new sql server availability group, make sure the parameter (ClusterParameter RegisterAllProvidersIP 1) setting is correct and other settings please refer following link. Reference: Configure availability group listener - SQL Server Always On | Microsoft Docs It's fun to learn something on sql server that I never met before even I'm already a certified sql server DBA with 10+ years hands-on working experience! :D

2021-09-09

Finding Missing Indexes to be added and Unused Indexes to be dropped

A few weeks ago I helped a client on performance tuning on their production SQL Server database. I provided them a bunch of scripts to do a performance health check. Finally we solved the database slowness problem by adding missing indexes and dropping unused indexes. In fact, I found most developers and software vendors don't bother to do index tuning on database or even they don't have such knowledge and skills. In this monthly blog post I would like to share you the script that I use to discover missing indexes and unused indexes. For missing indexes to be added, there may be some duplicated suggestions that you should merge them into one. Following the principles listed in my another article Indexing Guidelines, especially on the column ordering.

-- Top 10 Missing Indexes

SELECT TOP 10

DB_NAME(dm_mid.database_id) AS DatabaseName,

dm_migs.avg_user_impact*(dm_migs.user_seeks+dm_migs.user_scans) Avg_Estimated_Impact,

dm_migs.last_user_seek AS Last_User_Seek,

OBJECT_NAME(dm_mid.OBJECT_ID,dm_mid.database_id) AS [TableName],

'CREATE INDEX [IX_' + OBJECT_NAME(dm_mid.OBJECT_ID,dm_mid.database_id) + '_'

+ REPLACE(REPLACE(REPLACE(ISNULL(dm_mid.equality_columns,''),', ','_'),'[',''),']','') 

+ CASE

WHEN dm_mid.equality_columns IS NOT NULL

AND dm_mid.inequality_columns IS NOT NULL THEN '_'

ELSE ''

END

+ REPLACE(REPLACE(REPLACE(ISNULL(dm_mid.inequality_columns,''),', ','_'),'[',''),']','')

+ ']'

+ ' ON ' + dm_mid.statement

+ ' (' + ISNULL (dm_mid.equality_columns,'')

+ CASE WHEN dm_mid.equality_columns IS NOT NULL AND dm_mid.inequality_columns 

IS NOT NULL THEN ',' ELSE

'' END

+ ISNULL (dm_mid.inequality_columns, '')

+ ')'

+ ISNULL (' INCLUDE (' + dm_mid.included_columns + ')', '') AS Create_Statement

FROM sys.dm_db_missing_index_groups dm_mig

JOIN sys.dm_db_missing_index_group_stats dm_migs

ON dm_migs.group_handle = dm_mig.index_group_handle

JOIN sys.dm_db_missing_index_details dm_mid

ON dm_mig.index_handle = dm_mid.index_handle

WHERE dm_mid.database_ID = DB_ID()

AND OBJECTPROPERTY(dm_mid.[object_id], 'IsMsShipped') = 0

ORDER BY Avg_Estimated_Impact DESC

GO


-- Unused Indexes

SELECT

DB_NAME(dm_ius.database_id) AS DatabaseName,

o.[name] AS ObjectName,

i.[name] AS IndexName,

dm_ius.user_seeks AS UserSeek,

dm_ius.user_scans AS UserScans,

dm_ius.user_lookups AS UserLookups,

dm_ius.user_updates AS UserUpdates,

p.TableRows,

'DROP INDEX ' + QUOTENAME(i.name) + ' ON ' + QUOTENAME(s.name) + '.' + QUOTENAME(OBJECT_NAME(dm_ius.OBJECT_ID)) AS 'drop statement'

FROM sys.dm_db_index_usage_stats AS dm_ius

JOIN sys.indexes AS i ON i.index_id = dm_ius.index_id AND dm_ius.[object_id] = i.[object_id]

JOIN sys.objects AS o ON dm_ius.[object_id] = o.[object_id]

JOIN sys.schemas s ON o.[schema_id] = s.[schema_id]

JOIN (SELECT SUM([rows]) AS TableRows, index_id, [object_id] FROM sys.partitions GROUP BY index_id, [object_id]) AS p

ON p.index_id = dm_ius.index_id AND dm_ius.[object_id] = p.[object_id]

WHERE OBJECTPROPERTY(dm_ius.[object_id], 'IsUserTable') = 1

AND dm_ius.database_id = DB_ID()

AND i.[type_desc] = 'nonclustered'

AND i.is_primary_key = 0

AND i.is_unique_constraint = 0

AND (dm_ius.user_seeks + dm_ius.user_scans + dm_ius.user_lookups) = 0

ORDER BY TableRows DESC

GO

2021-08-02

Availability Group unexpected Failover due to LeaseTimeout and how to solve it

SQL Server Availability Group (AG) high relies on Windows Server Failover Cluster (WSFC) in failover detection. Frequent communication/heartbeat/ping called "Lease mechanism" is used to ensure that the two sides (the Cluster Service and SQL Server service) are in frequent contact, checking each other's state and ultimately preventing a split-brain scenario. By the way, if your AG primary replica is too heavily-loaded, it may occasionally just too busy to signal the WSFC service that it is still alive, in this case the WSFC will decide the SQL Server service is down and trigger a failover. You will see the below error message in the SQL Server Error Log:

Windows Server Failover Cluster did not receive a process event signal from SQL Server hosting availability group '<AG Group Name>' within the lease timeout period.
The state of the local availability replica in availability group '<AG Group Name>' has changed from 'PRIMARY_NORMAL' to 'RESOLVING_NORMAL'.  The state changed because the lease between the local availability replica and Windows Server Failover Clustering (WSFC) has expired.  For more information, see the SQL Server error log, Windows Server Failover Clustering (WSFC) management console, or WSFC log.

We can also read the same error from the Windows Cluster log:

SQL Server Availability Group <AG Group Name>: Lease renewal failed with timeout error.
SQL Server Availability Group <AG Group Name>: The lease is expired.

The lease is a heartbeat that detects the SQL Server process health hosting the primary replica. A thread runs at priority inside the SQL Server and communicates via a Windows event with the SQL Server resource DLL-hosted process (RHS.EXE) - if that thread does not respond within the lease timeout period, the SQL Server resource DLL reports a lease timeout and reports availability group no longer "looks alive", and the availability group resource transitions to RESOLVING state and fails over if configured to do so. Although the lease is primarily a synchronization mechanism between the primary instance and the cluster, it can also create failure conditions where there was otherwise no need to fail over. For example, high CPU, out-of-memory conditions (low virtual memory, process paging), SQL process not responding while generating a memory dump, system not responding, cluster (WSFC) going offline (e.g. due to quorum loss) can prevent lease renewal from the SQL instance and causing a restart or failover which is unexpected.
One resolution is to increase the LeaseTimeout value (default 20000, which means 20 seconds), for example, set it to 60000 (60 seconds). According to the Microsoft document, 1/2 * LeaseTimeout must be less than SameSubnetThreshold * SameSubnetDelay, and SameSubnetThreshold \<= CrossSubnetThreshold and SameSubnetDelay \<= CrossSubnetDelay should be true of all SQL Server clusters. So in order to set LeaseTimeout to let's say 60 secs, you must also increase the SubnetThreshold values and SubnetDelay values, by running the following PowerShell commands:

(get-cluster).SameSubnetDelay = 2000
(get-cluster).SameSubnetThreshold = 20
(get-cluster).CrossSubnetDelay = 4000
(get-cluster).CrossSubnetThreshold = 40
Get-Cluster | fl *subnet*

After you executed the above PowerShell commands, you set the LeaseTimeout value in Failover Cluster Manager > Roles > Availability Group Name > Other Resources > Right-click the AG resource at the bottom of the window (under Other Resources) and select Properties > properties tab. Follow these steps provided by Microsoft.

The new value of property 'LeaseTimeout' will take effect after the resource is taken offline and brought online again.

2021-07-02

Top 10 Expensive Queries in user database

This blog post shares the script to get top 10 most expensive queries in the current database on SQL Server. It uses DMVs (mainly sys.dm_exec_query_stats) so it works on all support versions from SQL Server 2012 to SQL Server 2019, and it doesn't required you to enable any database features such as Query Store. You can modify it to add more top 10 figures that the dm_exec_query_stats DMV has. The results contain a query_plan column that you can save the XML content as a .sqlplan file so that it can be opened by SSMS in another computer to view the graphical execution plan of the expensive query. Here is the script:
-- Top 10 queries - total read
SELECT TOP 10
DB_NAME() AS [db_name],
OBJECT_NAME(qp.objectid) AS [object_name],
SUBSTRING(qt.[text], (qs.statement_start_offset/2)+1,
((CASE qs.statement_end_offset
WHEN -1 THEN DATALENGTH(qt.[text])
ELSE qs.statement_end_offset
END - qs.statement_start_offset)/2)+1) AS query_text,
qs.execution_count,
qs.total_logical_reads, (qs.total_logical_reads / qs.execution_count) AS avg_logical_reads,
qs.last_logical_reads,
qs.last_execution_time,
qp.query_plan
FROM sys.dm_exec_query_stats AS qs
CROSS APPLY sys.dm_exec_sql_text(qs.[sql_handle]) AS qt
CROSS APPLY sys.dm_exec_query_plan(qs.plan_handle) AS qp
ORDER BY qs.total_logical_reads DESC;

-- Top 10 queries - avg read
SELECT TOP 10
DB_NAME() AS [db_name],
OBJECT_NAME(qp.objectid) AS [object_name],
SUBSTRING(qt.[text], (qs.statement_start_offset/2)+1,
((CASE qs.statement_end_offset
WHEN -1 THEN DATALENGTH(qt.[text])
ELSE qs.statement_end_offset
END - qs.statement_start_offset)/2)+1) AS query_text,
qs.execution_count,
qs.total_logical_reads, (qs.total_logical_reads / qs.execution_count) AS avg_logical_reads,
qs.last_logical_reads,
qs.last_execution_time,
qp.query_plan
FROM sys.dm_exec_query_stats AS qs
CROSS APPLY sys.dm_exec_sql_text(qs.[sql_handle]) AS qt
CROSS APPLY sys.dm_exec_query_plan(qs.plan_handle) AS qp
ORDER BY avg_logical_reads DESC;

-- Top 10 queries - total write
SELECT TOP 10
DB_NAME() AS [db_name],
OBJECT_NAME(qp.objectid) AS [object_name],
SUBSTRING(qt.[text], (qs.statement_start_offset/2)+1,
((CASE qs.statement_end_offset
WHEN -1 THEN DATALENGTH(qt.[text])
ELSE qs.statement_end_offset
END - qs.statement_start_offset)/2)+1) AS query_text,
qs.execution_count,
qs.total_logical_writes, (qs.total_logical_writes / qs.execution_count) AS avg_logical_writes,
qs.last_logical_writes,
qs.last_execution_time,
qp.query_plan
FROM sys.dm_exec_query_stats AS qs
CROSS APPLY sys.dm_exec_sql_text(qs.[sql_handle]) AS qt
CROSS APPLY sys.dm_exec_query_plan(qs.plan_handle) AS qp
ORDER BY qs.total_logical_writes DESC;

-- Top 10 queries - avg write
SELECT TOP 10
DB_NAME() AS [db_name],
OBJECT_NAME(qp.objectid) AS [object_name],
SUBSTRING(qt.[text], (qs.statement_start_offset/2)+1,
((CASE qs.statement_end_offset
WHEN -1 THEN DATALENGTH(qt.[text])
ELSE qs.statement_end_offset
END - qs.statement_start_offset)/2)+1) AS query_text,
qs.execution_count,
qs.total_logical_writes, (qs.total_logical_writes / qs.execution_count) AS avg_logical_writes,
qs.last_logical_writes,
qs.last_execution_time,
qp.query_plan
FROM sys.dm_exec_query_stats AS qs
CROSS APPLY sys.dm_exec_sql_text(qs.[sql_handle]) AS qt
CROSS APPLY sys.dm_exec_query_plan(qs.plan_handle) AS qp
ORDER BY avg_logical_writes DESC;

-- Top 10 queries - total cpu time
SELECT TOP 10
DB_NAME() AS [db_name],
OBJECT_NAME(qp.objectid) AS [object_name],
SUBSTRING(qt.[text], (qs.statement_start_offset/2)+1,
((CASE qs.statement_end_offset
WHEN -1 THEN DATALENGTH(qt.[text])
ELSE qs.statement_end_offset
END - qs.statement_start_offset)/2)+1) AS query_text,
qs.execution_count,
qs.total_worker_time, (qs.total_worker_time / qs.execution_count) AS avg_worker_time,
qs.last_worker_time,
qs.last_execution_time,
qp.query_plan
FROM sys.dm_exec_query_stats AS qs
CROSS APPLY sys.dm_exec_sql_text(qs.[sql_handle]) AS qt
CROSS APPLY sys.dm_exec_query_plan(qs.plan_handle) AS qp
ORDER BY qs.total_worker_time DESC;

-- Top 10 queries - avg cpu time
SELECT TOP 10
DB_NAME() AS [db_name],
OBJECT_NAME(qp.objectid) AS [object_name],
SUBSTRING(qt.[text], (qs.statement_start_offset/2)+1,
((CASE qs.statement_end_offset
WHEN -1 THEN DATALENGTH(qt.[text])
ELSE qs.statement_end_offset
END - qs.statement_start_offset)/2)+1) AS query_text,
qs.execution_count,
qs.total_worker_time, (qs.total_worker_time / qs.execution_count) AS avg_worker_time,
qs.last_worker_time,
qs.last_execution_time,
qp.query_plan
FROM sys.dm_exec_query_stats AS qs
CROSS APPLY sys.dm_exec_sql_text(qs.[sql_handle]) AS qt
CROSS APPLY sys.dm_exec_query_plan(qs.plan_handle) AS qp
ORDER BY avg_worker_time DESC;

-- Top 10 queries - total memory grant
SELECT TOP 10
DB_NAME() AS [db_name],
OBJECT_NAME(qp.objectid) AS [object_name],
SUBSTRING(qt.[text], (qs.statement_start_offset/2)+1,
((CASE qs.statement_end_offset
WHEN -1 THEN DATALENGTH(qt.[text])
ELSE qs.statement_end_offset
END - qs.statement_start_offset)/2)+1) AS query_text,
qs.execution_count,
qs.total_grant_kb, (qs.total_grant_kb / qs.execution_count) AS avg_grant_kb,
qs.last_grant_kb,
qs.last_execution_time,
qp.query_plan
FROM sys.dm_exec_query_stats AS qs
CROSS APPLY sys.dm_exec_sql_text(qs.[sql_handle]) AS qt
CROSS APPLY sys.dm_exec_query_plan(qs.plan_handle) AS qp
ORDER BY qs.total_grant_kb DESC;

-- Top 10 queries - avg memory grant
SELECT TOP 10
DB_NAME() AS [db_name],
OBJECT_NAME(qp.objectid) AS [object_name],
SUBSTRING(qt.[text], (qs.statement_start_offset/2)+1,
((CASE qs.statement_end_offset
WHEN -1 THEN DATALENGTH(qt.[text])
ELSE qs.statement_end_offset
END - qs.statement_start_offset)/2)+1) AS query_text,
qs.execution_count,
qs.total_grant_kb, (qs.total_grant_kb / qs.execution_count) AS avg_grant_kb,
qs.last_grant_kb,
qs.last_execution_time,
qp.query_plan
FROM sys.dm_exec_query_stats AS qs
CROSS APPLY sys.dm_exec_sql_text(qs.[sql_handle]) AS qt
CROSS APPLY sys.dm_exec_query_plan(qs.plan_handle) AS qp
ORDER BY avg_grant_kb DESC;

2021-06-01

Top 10 High Memory Grants Queries

If you have a database server that looked like it had been suffering from memory contention, you should check what queries were being run that had high memory requirements. Before the SQL Server database engine can execute a submitted query, SQL Server grants the requested memory to the query, such memory is requested for sort operators, hash operators, and parallelism operators in the execution plan. Without the memory grants, a query cannot be started to execute, and the most important point is a query which is waiting in a Resource Semaphore queue can be only executed when ALL lower-cost queues do not contain any other waiting queries. The SQL Server Query Store is a relatively new feature introduced in SQL Server 2016, a common scenario for using this feature is identifying top n queries (by execution time, memory consumption, etc.) in the past x hours. The column max_query_max_used_memory from sys.query_store_runtime_stats DMV is the maximum memory grant (reported as the number of 8 KB pages) for the query plan within the aggregation interval. Below script uses the Query Store to find out the top 10 queries with the highest memory grants over the last 24 hours in an user database:

USE [master]

GO

ALTER DATABASE [AppDB] SET QUERY_STORE = ON

GO

ALTER DATABASE [AppDB] SET QUERY_STORE (OPERATION_MODE = READ_WRITE)

GO

USE [AppDB]

GO

DECLARE @hours int = 24;

SELECT TOP 10 DB_NAME() AS DB, S.[name] AS SchemaName, O.[name] AS ObjectName,

SUBSTRING(t.query_sql_text, 1, 1000) AS QueryText,

CAST(MAX(rs.max_query_max_used_memory * 8 / 1024.0) AS decimal(9, 2)) AS MaxMemoryMB

FROM sys.query_store_query AS Q

JOIN sys.query_store_query_text AS T ON Q.query_text_id = T.query_text_id

JOIN sys.query_store_plan AS P ON Q.query_id = P.query_id

JOIN sys.query_store_runtime_stats AS RS ON P.plan_id = RS.plan_id

JOIN sys.query_store_runtime_stats_interval AS RSI ON Rs.runtime_stats_interval_id = RSI.runtime_stats_interval_id

LEFT JOIN sys.objects AS O ON Q.object_id = O.[object_id]

LEFT JOIN sys.schemas AS S ON O.schema_id = S.[schema_id]

WHERE RSI.start_time > DATEADD(hour, -@hours, GETDATE())

AND t.query_sql_text NOT LIKE '%SELECT TOP 10 DB_NAME() AS DB%'

GROUP BY S.[name], O.[name], SUBSTRING(T.query_sql_text, 1, 1000)

ORDER BY MaxMemoryMB DESC;

2021-05-01

Free performance analyzing tool - solarwinds SQL Plan Warnings

This month blog post I would like to introduce a free performance analyzing tool solarwinds SQL Plan Warnings that provides instant visibility into SQL Server query plan warnings. This awesome tool doesn't require you to install anything into your database server or sql instance, it is just an executable that you can run it in a client host which able to access the sql instance. Here comes a demo of how to use it.

  1. Download the tool into your client host and unzip it.
     
  2. Run the extracted SQL-Plan-Warnings.exe

  3. Click Connect to instance

  4.  Choose the database type, e.g. Microsoft SQL Server, click Next.

  5.  Enter the sql server instance, port number, and authentication information, click Connect.

  6.  Click the settings icon on the upper right corner.

  7. Modify the filter settings per your workload characteristics, then press Save.

  8. Let your database server to execute some workload, e.g.

  9. If some of the queries had plan warnings that match the filtering settings you set before, it will be shown by the SQL Plan Warnings tool, you can press refresh to get the latest result.

  10. You can further investigate the execution plan by mouse-over the result and click show plan.

There are many free tools for SQL Server on the internet, as a database administrator we need to test them thoroughly and then use them on even our production database without hesitation, in order to make our work more efficient.

2021-04-01

Boosting Analytics Query using Columnstore Index

While row store table and B-tree index perform very well for transactional operations include insert/update/delete and selecting small number of rows, analytics query which access large range of rows will incur high I/O on B-tree index. SQL Server 2012 introduced columnstore index which target analytics query, and SQL Server 2016 further enhanced columnstore index to make it updateable nonclustered columnstore index on heap or B-tree. In this blog post I'm going to show you how columnstore index boost up an analytics query, using the StackOverflow2010 database to demo.

Let's say we have the following analytics query to run:
SELECT U.DisplayName, MAX(P.Score)
FROM Users U JOIN Posts P ON U.Id = P.OwnerUserId
GROUP BY U.DisplayName;

Without any nonclustered index, table scan on both tables are required to run this query.

The execution time and I/O incurred are huge (817,869 logical reads, elapsed time 01:05).

Now we add a nonclustered B-tree index with included column:
CREATE INDEX IX_Posts ON Posts (OwnerUserId) INCLUDE(Score);

The analytics query runs faster by using the new index (22,319 logical reads, elapsed time 8 secs).


Let's create a columnstore index and see how it further boost up the query:
CREATE NONCLUSTERED COLUMNSTORE INDEX CI_Posts ON Posts (OwnerUserId, Score);

The analytics query now using the columnstore index which incur lesser I/O and more faster.
Table 'Posts'. Segment reads 5, segment skipped 0.
Table 'Users'. Scan count 5, logical reads 14,783. Elapsed time 3.4 secs.


For a deeper insight into columnstore index design, you can take a look into the design guidance provided by Microsoft.

2021-03-02

Backup Compression for TDE Databases

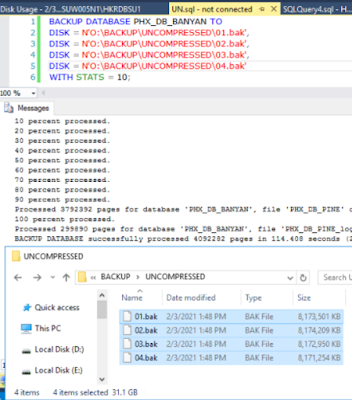
Backup Compression and TDE were both released as SQL Server 2008, but they were not work so well together, the backup compression ratio for TDE enabled database was nearly nothing. SQL Server 2016 has a hidden gem that easily be overlooked in the SQL Server BOL BACKUP SQL documentation, saying "Starting with SQL Server 2016 (13.x), setting MAXTRANSFERSIZE larger than 65536 (64 KB) enables an optimized compression algorithm for Transparent Data Encryption (TDE) encrypted databases that first decrypts a page, compresses it, and then encrypts it again. If MAXTRANSFERSIZE is not specified, or if MAXTRANSFERSIZE = 65536 (64 KB) is used, backup compression with TDE encrypted databases directly compresses the encrypted pages, and may not yield good compression ratios.". In this blog post, let's do experiment on backup a TDE enabled database, to compare the differences between the default (no compression), specified WITH COMPRESSION but no max transfer size, and WITH COMPRESSION plus MAXTRANSFERSIZE greater than 64KB.

Here I have a TDE encrypted database, data size 30GB, in a SQL Server 2016 instance.

Backup with default option (uncompressed)


Backup with COMPRESSION option but no max transfer size specified

 
Backup with COMPRESSION and MAXTRANSFERSIZE greater than 64kb

As you can see, only the BACKUP WITH COMPRESSION and MAXTRANSFERSIZE > 64kb can really compress the backup.

Good news:
Starting with SQL Server 2019 (15.x) CU5, setting MAXTRANSFERSIZE is no longer required to enable this optimized compression algorithm with TDE. If the backup command is specified WITH COMPRESSION or the backup compression default server configuration is set to 1, MAXTRANSFERSIZE will automatically be increased to 128K to enable the optimized algorithm.

2021-02-08

Resumable Online Index Operations

Starting from SQL Server 2017, a great feature was introduced, called Resumable Online Index Operation, which allows online index rebuild can be paused and resumed. And SQL Server 2019 enhanced this by allowing online index creation resumable. In this blogpost, let's have a deep dive into how to use this new indexing options, and attentions you need to take when using it. Here I use the SQL Server 2019 Developer edition and StackOverflow2010 database to do the demo.

Create an new index with RESUMABLE = ON
CREATE INDEX IX_Votes_UserId ON Votes (UserId) WITH (ONLINE = ON, RESUMABLE = ON);

Check the current execution status for resumable index operation
A new DMV sys.index_resumable_operations let you to check the status and progress for resumable online operations in the current database.

Pause the index operation
ALTER INDEX IX_Votes_UserId ON Votes PAUSE;

Can log space be reclaimed by log backup when resumable index operation paused?
YES!


Resume the paused index operation
ALTER INDEX IX_Votes_UserId ON Votes RESUME;

What happened if the index operation being KILL?
It will become PAUSED if the index operation being killed.

How to cancel the index operation
ALTER INDEX IX_Posts_ParentId ON Posts ABORT;

From the above experiment, we can see that being able to pause and resume your online index operations allows you a way to do these operations in a piecemeal approach, and more importantly allow you to free up transaction log space during the index operation still undergoing.

2021-01-01

Read-Only Routing of Availability Group

One of the main benefits of SQL Server AlwaysOn Availability Group is being able to scale out read-only workload to secondary replicas. By default, Read-Only Routing is not automatically enabled when you build your availability group which most of you done by SQL Server Management Studio GUI. Read-only routing can only be configured using Transact-SQL or PowerShell command. In this blog post I'm going to demonstrate how to configure read-only routing using Transact-SQL.
Let's say you already configured an availability group using the GUI wizard in SSMS. In this example I have two availability replicas.

1. Execute ALTER AVAILABILITY GROUP MODIFY REPLICA statements in order to allow secondary role read-only connections and specify read-only routing URL for each replica:

2. For each replica that you want to support read-only routing when it is the primary replica, you need to specify a read-only routing list. A given read-only routing list takes effect only when the local replica is running under the primary role:

3. Execute below query to verify the read-only routing list was set properly:
SELECT   AVGSrc.replica_server_name AS SourceReplica
 , AVGRepl.replica_server_name AS ReadOnlyReplica
 , AVGRepl.read_only_routing_url AS RoutingURL
 , AVGRL.routing_priority AS RoutingPriority
 FROM sys.availability_read_only_routing_lists AVGRL
 INNER JOIN sys.availability_replicas AVGSrc ON AVGRL.replica_id = AVGSrc.replica_id
 INNER JOIN sys.availability_replicas AVGRepl ON AVGRL.read_only_replica_id = AVGRepl.replica_id
 INNER JOIN sys.availability_groups AV ON AV.group_id = AVGSrc.group_id
 ORDER BY SourceReplica;


4. Test read-only routing using SQLCMD with the –K readonly parameter, along with the listener name and the database name in the availability group. The output shows the secondary replica receiving read connections according to read-only routing list: